The Power BI template for Trade Control presents users with Business Intelligence data. It communicates several useful indicators and provides a basis for further development and customisation. Once published to the BI Service, users can interact with the information by creating their own dashboards and workspaces on tablets and mobile phones.
The template also works with bitcoin as unit of account.
Follow the instructions for installing the Power BI Template.
The template has separate pages for finance, statements and sales analysis.
The information presented in the following screenshots is fictitious.
The underlying data for this page is taken from unaggregated Sql Server views, also presented in the Office 365 interface.
Trade Control calculates the tax burden with transaction grained frequency. Because it also reconciles to cash accounts that can mirror money in the bank, it is possible to report on the real-time financial health of the business.
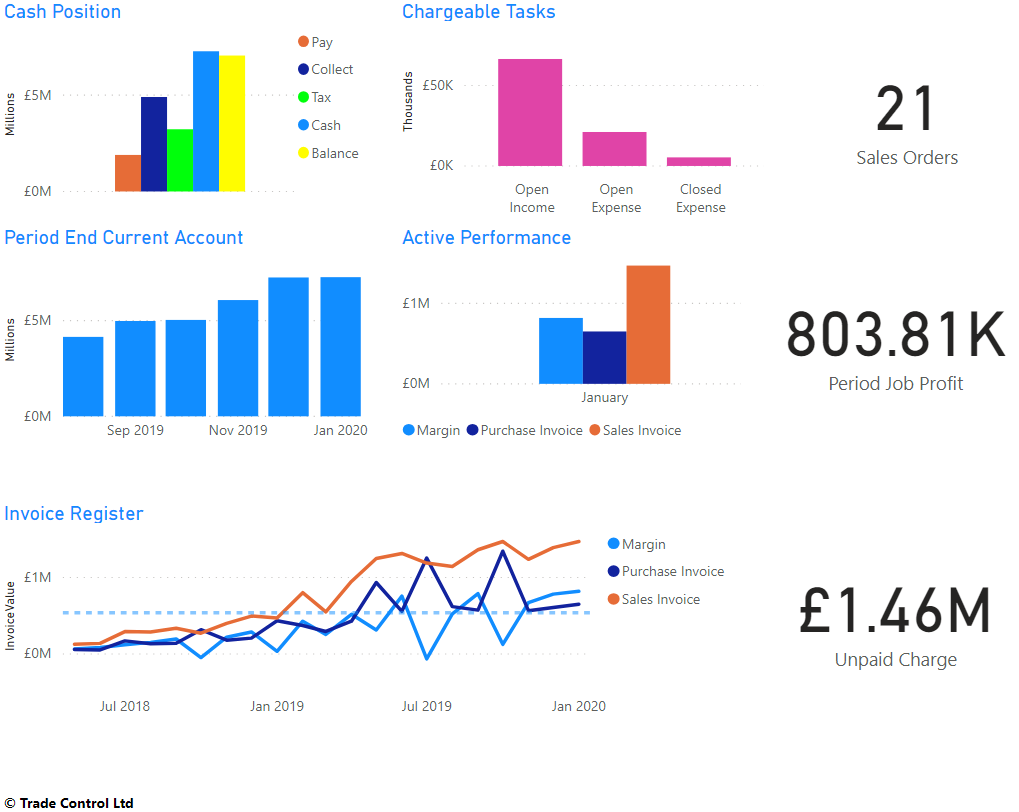
Each task is a structured project, so profitability can be established at any level. Job profit is calculated for top-level orders by recursing over the structure and deducting costs from the total charge.
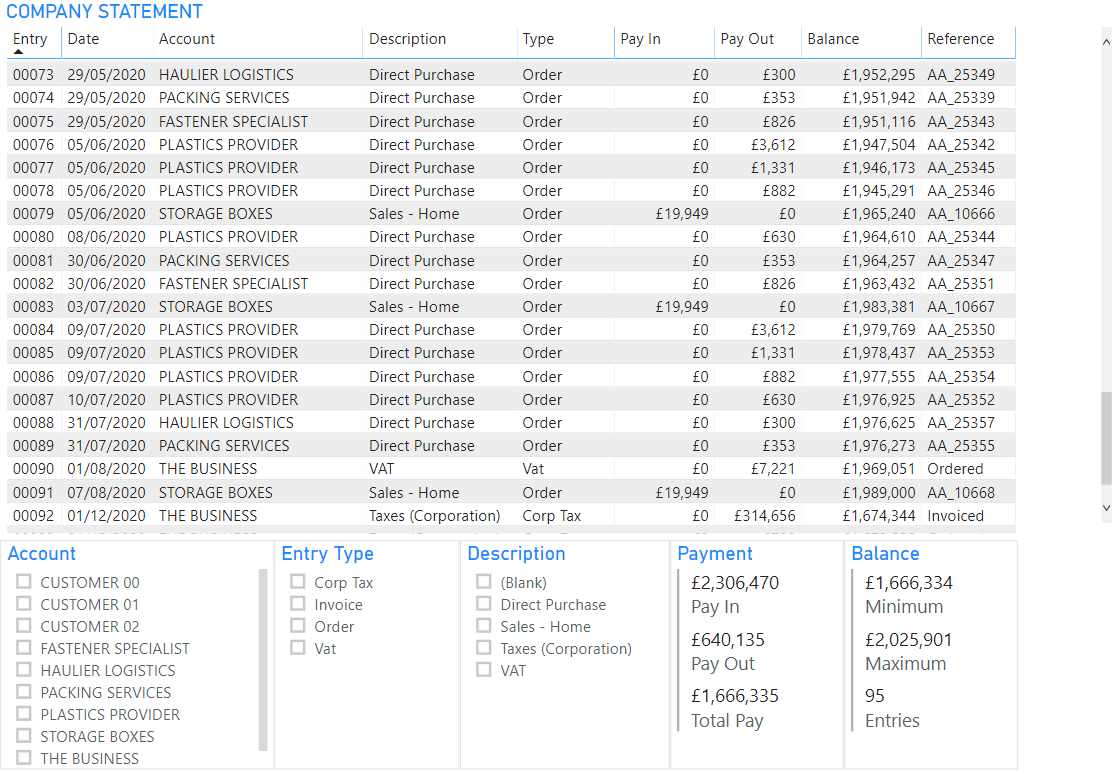
Power BI can present data grids to the user. The Company Statement is a transaction-grained forward projection of income, expenditure, expenses and tax, beginning with the balance of the trading cash account. As work is scheduled and accruals entered, that balance is constantly being revised. It is therefore an aid in scheduling workloads so that the business can remain profitable in the future.
The template allows you to splice the statement by account, entry type and cash code. This means you can examine, in one statement, the company position for the sales and purchasing order books, invoices, expenses, accruals, taxes and cash classifications.
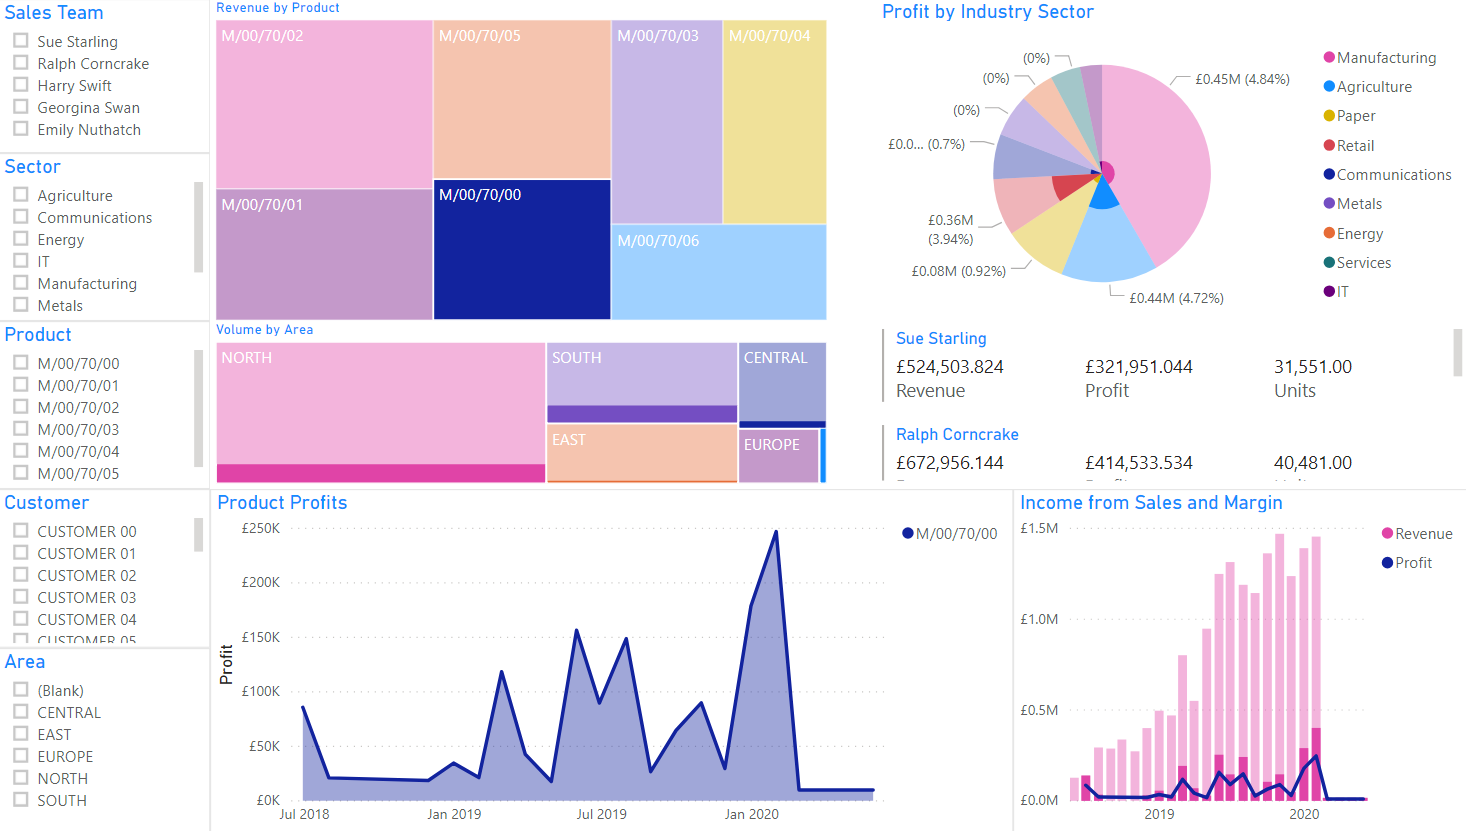
This page reflects your standard approach to BI reporting. There is no end to the amount of Sales Analysis you can do, but here we show how Trade Control can be used to generate the sort of stuff sales teams like to see - volume, income and profit by various criteria such as product, customer, sales rep, region and industry type.
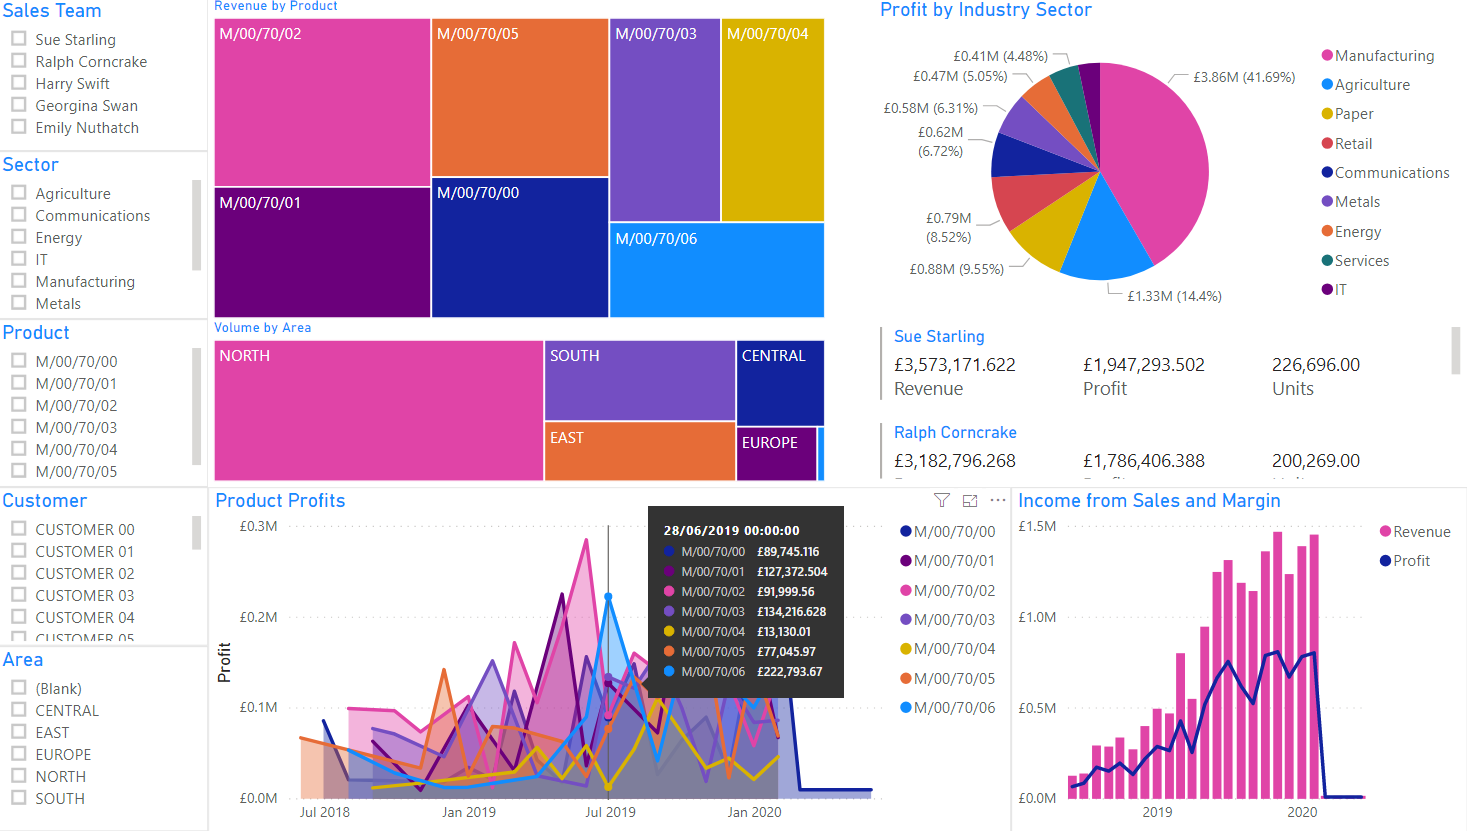
You can click on any of the selection lists to splice the data, but you can also interact with the graphs. The screenshot below shows how selecting the M/00/70/00 product in the Revenue by Product Tree Map impacts the other visualisations.